Snow Day Map Reading: A Beginner to Pro Guide
Snow Day • By Jon Snow • September 11, 2026
Most parents check one map, see a big blob of blue or pink over their town, and assume school's cancelled. That's how you end up disappointed at 6 a.m. when the district sends a normal-schedule alert instead. The maps carry more information than a color blob. Here's how to actually read them, starting from the basics and working up to what meteorologists themselves check before a storm.
Level 1: The snowfall accumulation map
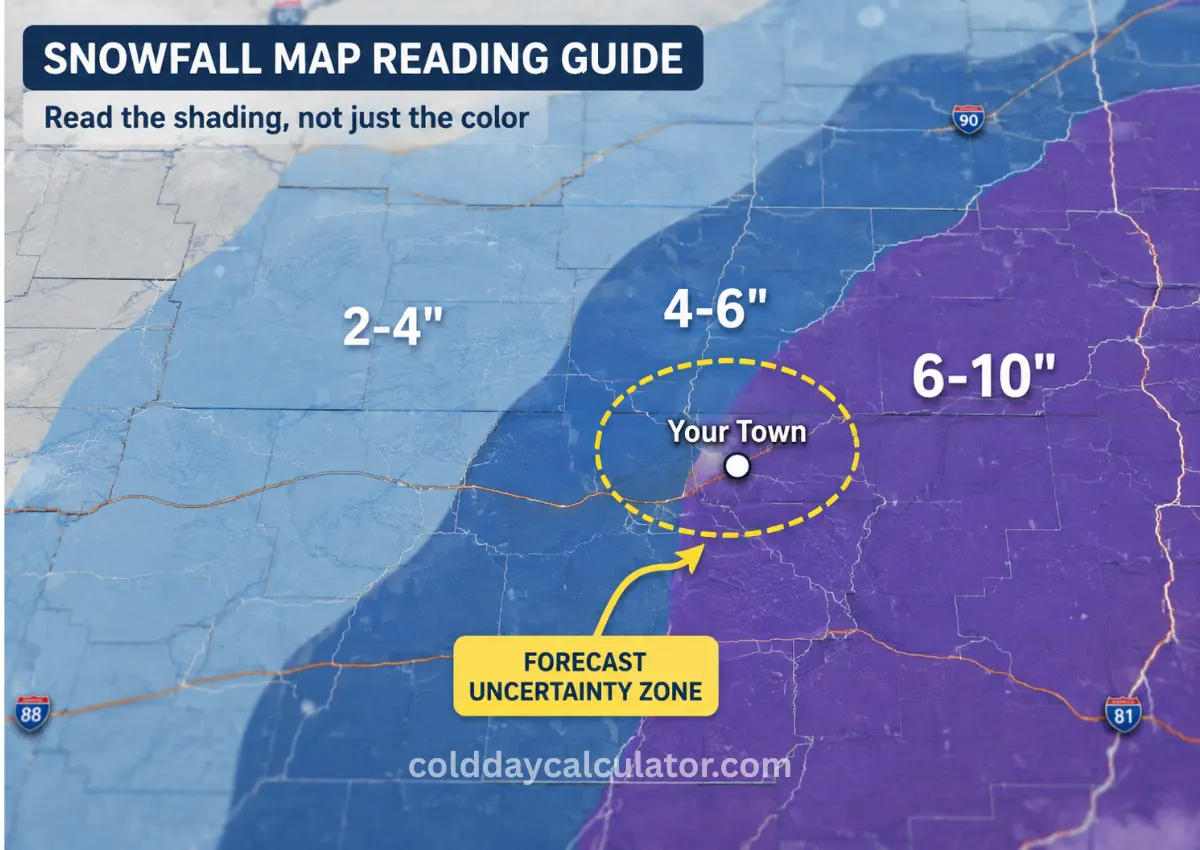
Start at weather.gov and search your local National Weather Service office. Every office publishes an "Expected Snowfall" map for its region, usually shown as shaded bands with a number range: 2 to 4 inches, 4 to 8 inches, 8 to 12, and so on. That's the official forecast, not a model output, and it's the number your local school district is actually watching.
Two things beginners miss here. First, the map usually covers a specific window, often 12, 24, or 48 hours, so check the timestamp before assuming it means "by morning." Second, county and district lines rarely match the shading exactly. If your town sits right on the edge between a 2 to 4 inch band and a 6 to 10 inch band, you're in the coin-flip zone and the forecast could shift either way overnight.
Level 2: Watches, warnings, and advisories
These aren't interchangeable, and the label tells you more than the map shading does.
- Winter Storm Watch: conditions are favorable for a significant storm, but it's not locked in. Usually issued 12 to 36 hours ahead. Treat this as "pack the bag, don't cancel plans yet."
- Winter Storm Warning: heavy snow, sleet, or ice is expected and confidence is high. Usually issued 6 to 18 hours ahead. This is the one that correlates most closely with actual school closures.
- Winter Weather Advisory: snow or ice is expected but won't hit warning-level totals. Roads get messy, but this rarely closes schools on its own.
- Blizzard Warning: a specific criteria, not just "a lot of snow." It requires sustained or gusty winds of 35 mph or more, cutting visibility to a quarter mile or less, for at least 3 hours. A storm can drop less snow than a Winter Storm Warning event and still shut a district down faster because of this one.
- Lake Effect Snow Warning: specific to areas near the Great Lakes. These form in narrow bands that can drop a foot of snow on one town while the next town over gets almost nothing, so don't assume a regional warning applies evenly across your county.
Level 3: Reading the probability, not just the total
This is where most people stop, and it's also where the map starts lying to you if you only look at the headline number. NWS offices also publish probabilistic snowfall graphics, usually shown as three separate maps: a 10th percentile (low-end, 90% chance of exceeding this), a 50th percentile (the most likely middle outcome), and a 90th percentile (a high-end scenario that's still plausible).
If the 10th percentile map shows 1 inch and the 90th percentile map shows 10 inches for your area, that's not a bad forecast, it's an honest one. It means the storm's track is still uncertain 24 to 48 hours out. The tighter the range between those two maps, the more confident you can be in the number. The wider the spread, the more it's worth waiting for a later update instead of planning around the middle number.
Level 4: Reading radar during the event
Once snow starts falling, switch from forecast maps to live radar. Two things matter here that beginners skip past: the color intensity and the movement direction. Heavier returns (usually shown in yellow, orange, or red on most radar apps) mean higher snowfall rates, not necessarily more total snow, since a band that moves through fast can drop less than a lighter band that stalls over your town for hours. Watch the radar loop, not a single frame, to see whether a heavy band is moving through or parked.
Level 5: What the pros actually check
Meteorologists and serious weather-watchers cross-reference a few extra sources before calling a storm:
- The Winter Storm Severity Index (WSSI) from NOAA's Weather Prediction Center, which combines snowfall, ice, wind, and duration into a single impact score instead of just a snow total. A lower-snow, high-wind event can outrank a bigger, calmer snowfall on this index.
- Model comparison, usually GFS against the European model (ECMWF), on a site like Pivotal Weather. When both models agree closely on storm track and totals, confidence is high. When they diverge by more than a hundred miles on storm track, that's the sign a forecast is still likely to change.
- The Winter Storm Outlook, also from WPC, which shows the probability of a location meeting local Winter Storm Warning criteria over the next 4 days, updated twice daily. It's a good early signal before the local office commits to a Watch.
Turning any of this into an actual snow day guess
None of these maps say "school closed" or "school open" because that call belongs to your district, not the National Weather Service. But most districts lean on the same inputs: a Winter Storm Warning in effect before the morning commute, snowfall totals near or above their own closure threshold (this varies by district and is often listed in the parent handbook), and road conditions from the local DOT. Check the Winter Storm Warning status first, then the 50th percentile snowfall map for your exact town, then your district's own alert system. That order gets you closer to a real answer than staring at one colorful map and guessing.
Frequently asked questions
Where do I find my local NWS snowfall map?
Go to weather.gov, enter your zip code, and look for the "Winter Weather" or "Expected Snowfall" link on your local office's page.
Why did the forecast total change overnight?
Storm tracks shift as they get closer, and a track shift of even 25 to 50 miles can move your town from the low end of a snowfall range to the high end. That's normal, not a bad forecast.
Is a Winter Storm Watch enough to guess a snow day?
Not on its own. A Watch means conditions are possible, not confirmed. Wait for a Warning, which is issued with much higher confidence and much closer to the event.
Do all districts use the same snow totals to decide closures?
No. Thresholds vary by district and depend on things like road conditions, bus routes, and rural versus urban geography, so 3 inches might close one district and barely register in another.
You May Like

Related Posts

Top The Snowy Day Picture Book Must-Read
The Snowy Day by Ezra Jack Keats is the book most US and Canadian kids meet first when winter shows ...

Best Snow Day Books for Kids: Cozy Winter Reads for Every Age
Best Snow Day Books for Kids can turn a long day stuck indoors into something kids actually look for...
90+ Snow Day Captions for Instagram, TikTok, Twitter & LinkedIn
Looking for the perfect snow day captions for Instagram, TikTok, Twitter (X), or LinkedIn? Whe...